HoRNet Plugins 85% off with the code BIGEASTER for the next |
Feature release for the multitrack spectrum analyzer
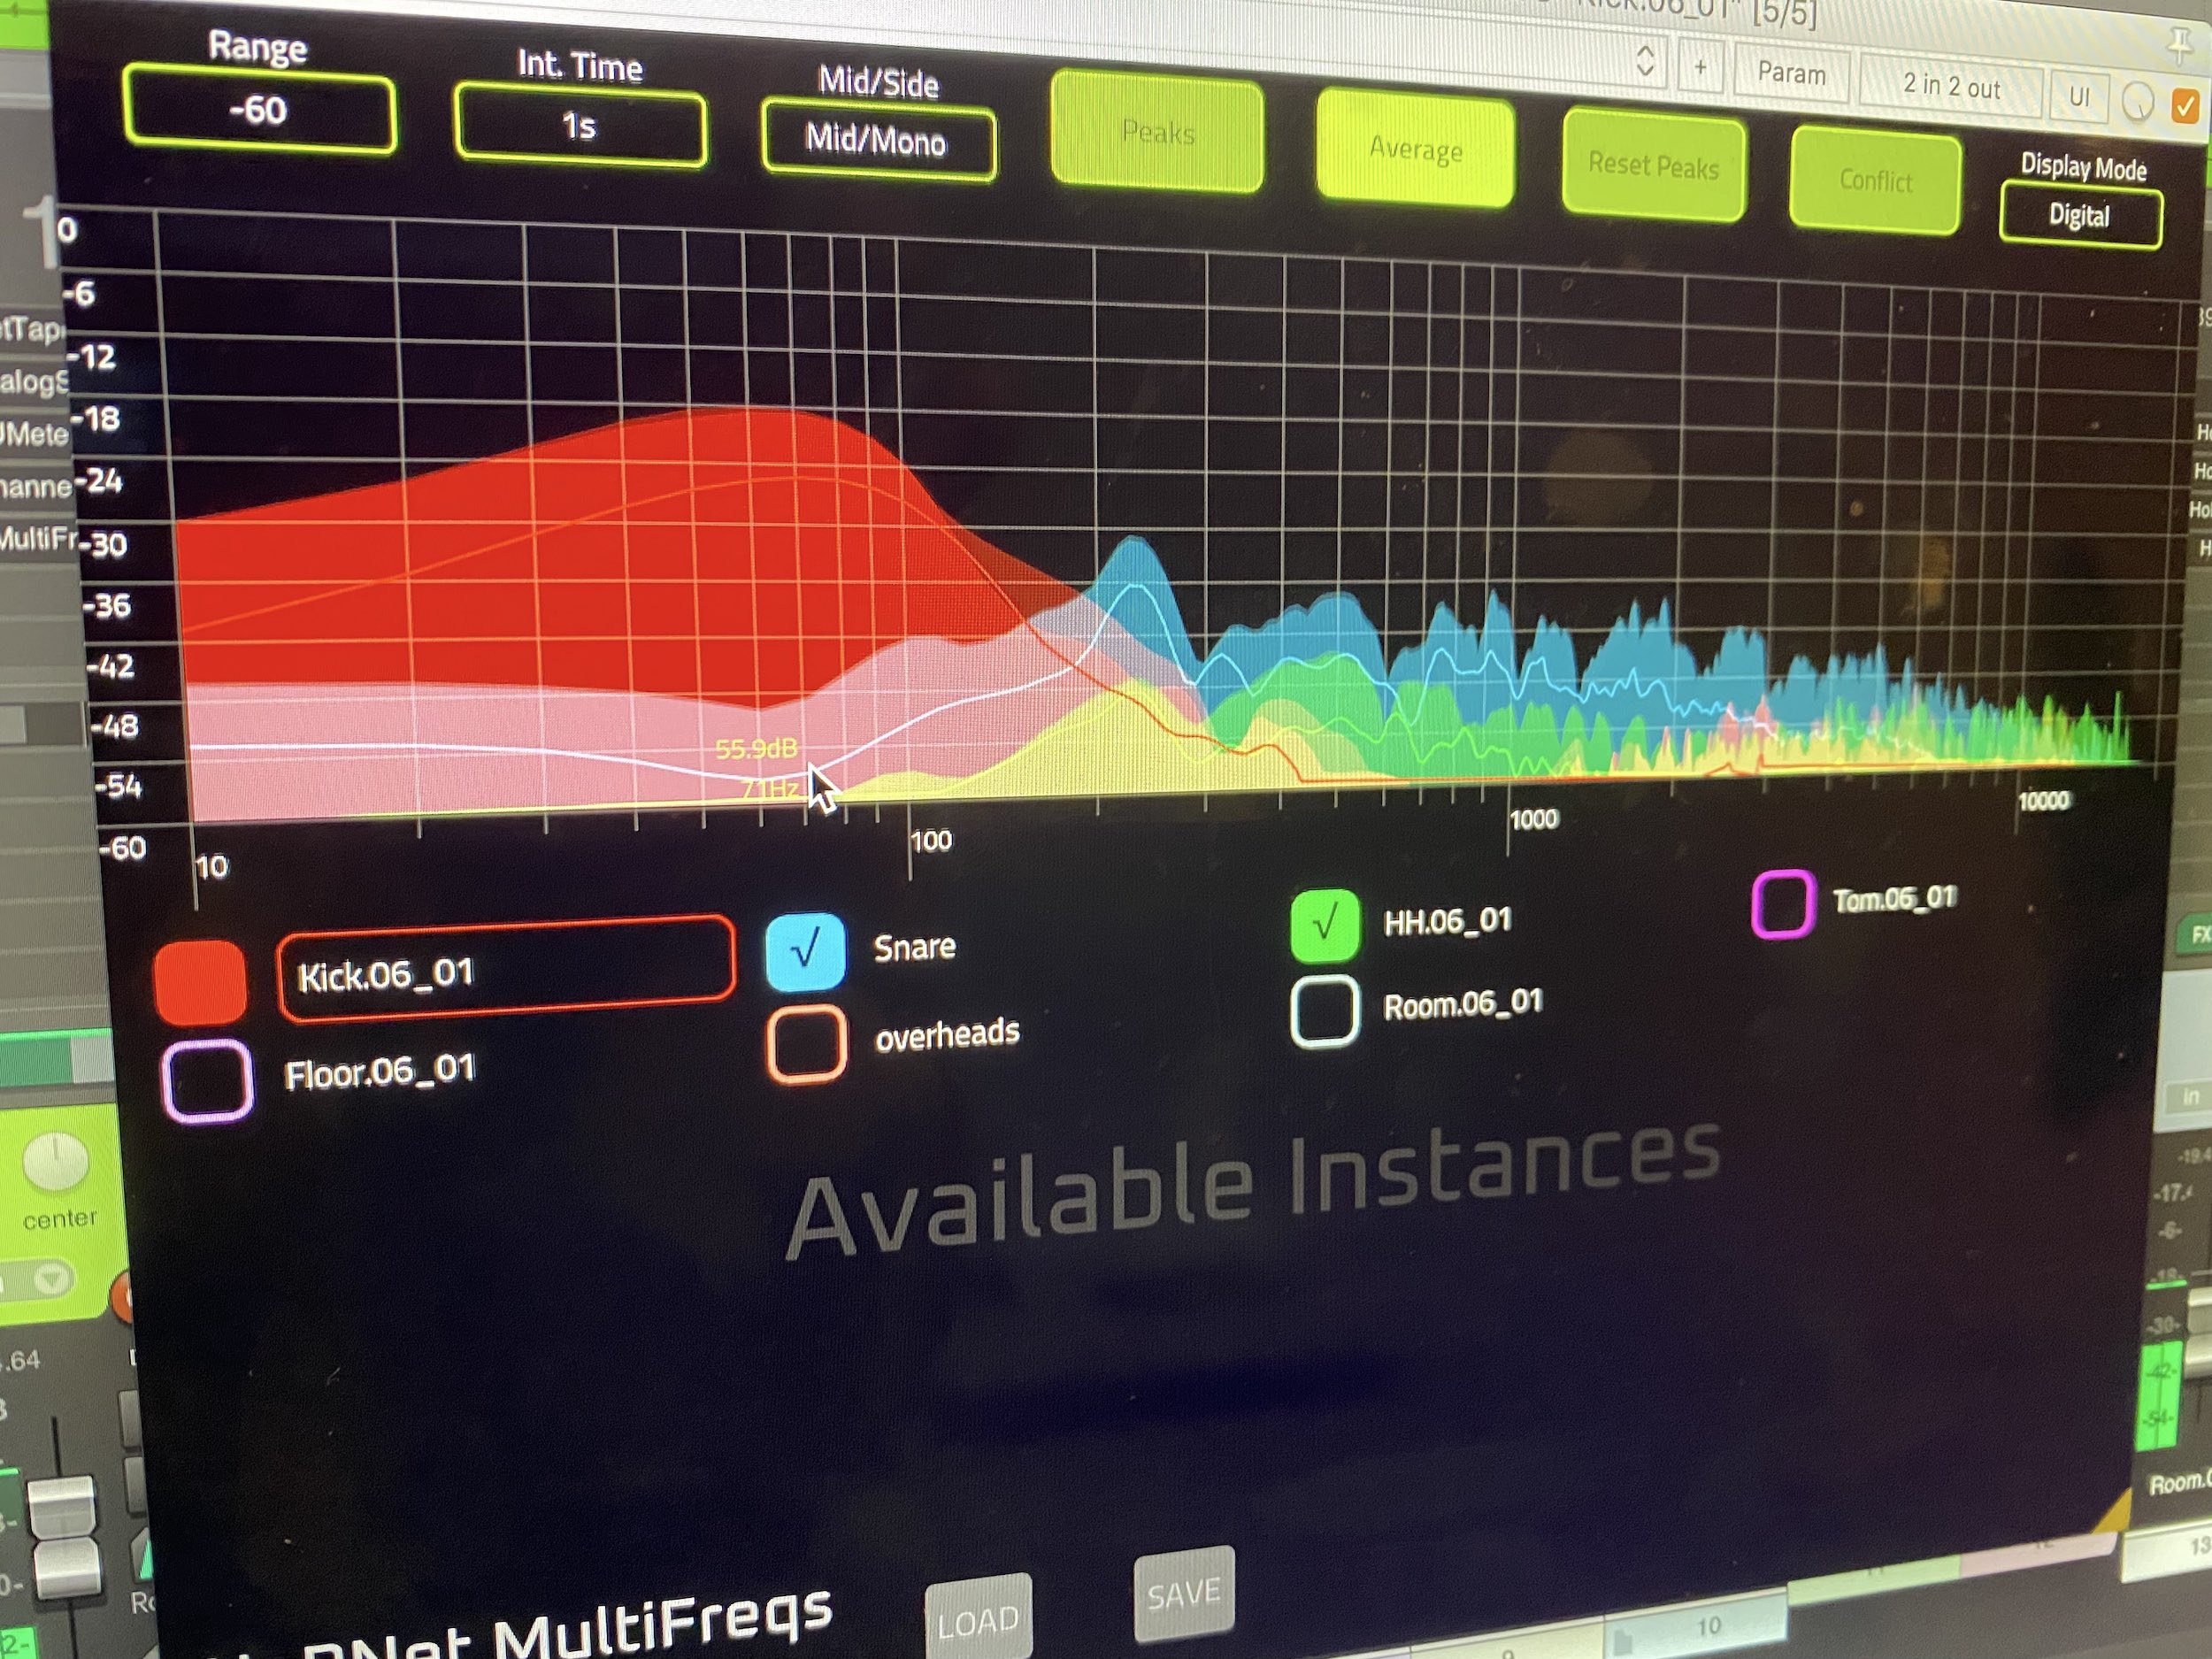
HoRNet MultiFreqs analyzes the audio spectrum for up to 28 tracks. It provides two types of visualization: “analog” and “digital.” The “analog” visualization mimics the classic hardware spectrum analyzer found in many recording studios. The “digital” visualization is our take on a standard FFT-based spectrum analyzer.
MultiFreqs features a completely resizable GUI. It delivers crisp and smooth visuals on any display, thanks to its hardware-accelerated drawing.
You can display up to 28 tracks simultaneously and choose which ones to show. The plugin reads track names on VST3 and AAX hosts, but you can easily change them by clicking on the instance name.
The plugin offers different integration times and ranges for the spectrum levels. It also provides peak and average display options. MultiFreqs can display the “mid” (sum) and “side” (difference) parts of a stereo signal to help you isolate problematic frequencies.
To quickly identify issues between tracks, use the “conflict” button. This feature shows only the parts of the spectrum common to all enabled tracks.
Using MultiFreqs helps you spot frequency collisions between tracks, like the snare and kick or kick and bass. It aids in achieving a clearer mix. When you close the GUI, MultiFreqs uses almost no CPU, so you can keep it active on every track and open it as needed.
Added ability to modify instance name in every plugin window
Added ability to read track name from DAW for AU
Fixed digital view color not updating unless window is closed and re open
Fixed VST3 being detected as mono only in some DAW
